
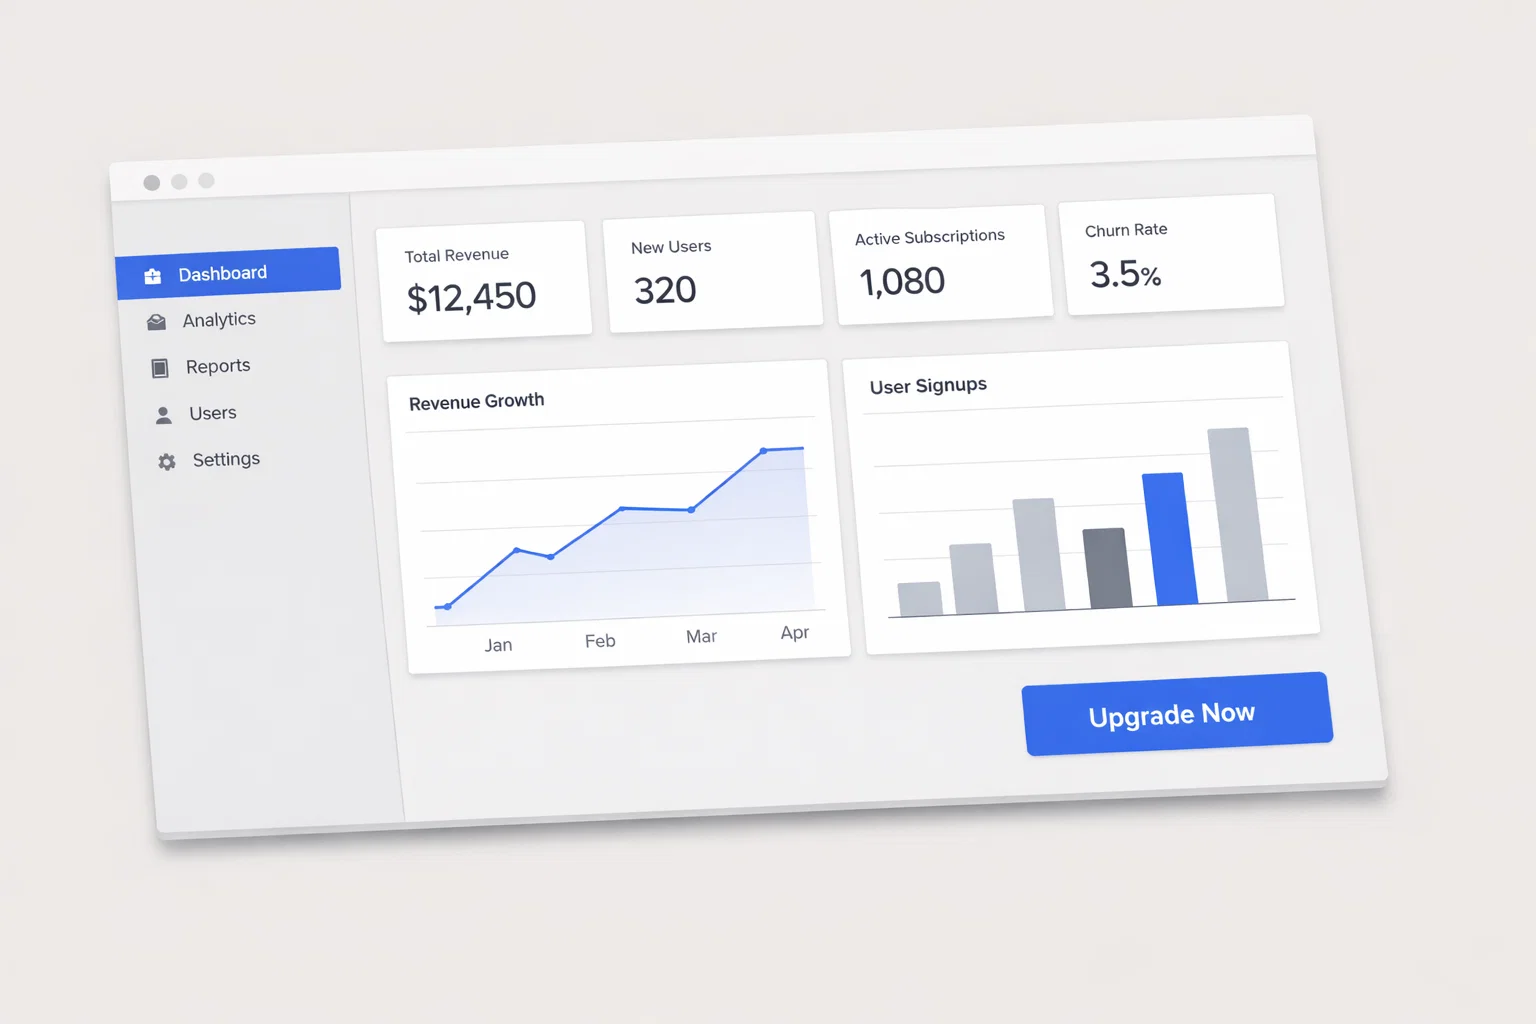
Investing in the 2025–2026 market landscape requires a departure from traditional “buy-and-hold” methodologies. As we navigate a cycle characterized by interest rate normalization and the integration of artificial intelligence into capital markets, the niche of Systematic Wealth Platforms and Digital Asset Management has emerged as a critical sub-sector.
This guide provides a structured framework for allocating capital toward technology-driven investment vehicles. We treat this not merely as a selection of software, but as a strategic commitment to algorithmic execution, data-driven alpha generation, and cost-efficient portfolio construction.
Executive Summary for Digital Wealth & Systematic Platforms
The investment thesis for systematic wealth platforms centers on the “democratization of institutional-grade strategies.” By leveraging high-frequency data and automated rebalancing, these platforms aim to reduce human bias and optimize tax-loss harvesting.
Core Investment Drivers:
- Fee Compression: Shift from high-cost active management to low-cost, technology-driven oversight.
- Hyper-Personalization: The ability to scale direct indexing and thematic tilts for individual accounts.
- Operational Efficiency: Automated execution reducing slippage and transaction costs.
Strategic Overview Table
| Metric | Assessment | Comment |
| Risk Profile | Moderate to High | Dependent on underlying asset volatility and model risk. |
| Return Expectation | Market+ (Alpha-seeking) | Aims for benchmark outperformance via systematic tilts. |
| Liquidity | High | Most platforms utilize exchange-traded underlying assets. |
| Time Horizon | 5–10 Years | Necessary to realize the benefits of compounded cost savings. |
Understanding the Nature of Systematic Wealth Platforms
The economic logic of this niche rests on the transition from “discretionary” to “rules-based” investing. In this model, value is created through the rigorous application of mathematical models to identify market inefficiencies.
Structural Characteristics:
- Rules-Based Execution: Eliminates emotional decision-making during periods of high market volatility.
- Scalability: Allows for the management of complex portfolios across thousands of accounts simultaneously.
- Transparency: Unlike traditional hedge funds, systematic platforms often provide real-time visibility into holdings and logic.
Comparison: Traditional vs. Systematic Asset Management
| Feature | Traditional Discretionary | Systematic Digital Platforms |
| Decision Base | Human intuition/Analysis | Quantitative models/Algorithms |
| Execution | Manual/Trader-led | Automated/API-driven |
| Cost Structure | High (AUM-based fees) | Low (Fixed or lower tier AUM) |
| Tax Efficiency | Periodic/Manual | Real-time/Automated harvesting |
Macroeconomic Drivers Affecting Digital Wealth (2025–2026)
The performance of systematic platforms is sensitive to the broader liquidity environment and the cost of capital. As the Federal Reserve stabilizes interest rates, the focus has shifted from “survival” to “yield optimization.”
Key Macro Factors:
- Interest Rate Normalization: A stable rate environment favors systematic models that rely on historical correlations.
- Inflation Dynamics: High inflation increases the demand for real-time portfolio adjustments, a core strength of digital platforms.
- Regulatory Scrutiny: Increased oversight on AI-driven trading (SEC/FINRA) affects operational costs and model transparency.
Macro Sensitivity Matrix
| Macro Factor | Impact Direction | Sensitivity Level |
| GDP Growth | Positive | Medium |
| Real Interest Rates | Inverse | High |
| Market Volatility (VIX) | Positive (for rebalancing) | High |
| Tech Regulation | Negative | Low |
Market Structure of Systematic Wealth Management
The market is currently bifurcated between institutional “quant” houses and retail-facing fintech applications. Institutional participants provide the liquidity and technical infrastructure, while retail platforms act as the distribution layer.
Key Participants:
- Infrastructure Providers: Firms providing the cloud computing and data feeds.
- Asset Originators: Issuers of the ETFs and fractional shares used within the platforms.
- End Investors: Increasingly composed of “Tech-Native” Millennials and Gen Z who prioritize UX and transparency.
Investment Vehicles for Gaining Exposure
Investors can access the systematic wealth niche through several channels, ranging from direct equity in platform providers to utilizing the platforms themselves for portfolio management.
Vehicle Evaluation Table
| Vehicle | Liquidity | Cost | Risk Level | Suitable For |
| Public Platform Equities | High | Low | High | Growth-oriented investors. |
| Thematic ETFs | High | Moderate | Medium | Diversified niche exposure. |
| Direct Indexing | Moderate | Moderate | Medium | High-net-worth (Tax focus). |
| Robo-Advisory | High | Low | Low-Medium | Core portfolio building. |
Selection: Identify the vehicle that aligns with your liquidity needs.- Due Diligence: Evaluate the underlying algorithm’s historical “backtest” vs. live performance.
- Capital Allocation: Determine if the vehicle serves as a “Core” or “Satellite” holding.
Fundamental Analysis Framework
When evaluating a systematic platform or a company within this space, we apply a disciplined quantitative framework. We look specifically at the robustness of the logic and the sustainability of the underlying technology.
Key Performance Indicators (KPIs):
- Algorithm Alpha: The excess return over a benchmark after accounting for risk.
- Tracking Error: The consistency with which the platform follows its stated strategy.
- Churn Rate: For platforms, this measures user retention; for portfolios, it measures turnover costs.
Valuation Metrics for Digital Wealth Entities
| Metric | Significance | Target Range (2026) |
| EV / AUM | Standard for asset managers | 1% – 3% |
| CAC / LTV | Efficiency of growth | < 0.33 |
| Net Revenue Retention | Platform stickiness | > 105% |
Technical and Quantitative Evaluation
In systematic investing, “technicals” refer to the statistical properties of the return stream. We analyze the “shape” of returns to ensure they meet institutional risk standards.
Analytical Steps:
- Volatility Assessment: Measure the standard deviation of daily returns.
- Drawdown Analysis: Evaluate the maximum peak-to-trough decline.
- Correlation Mapping: Ensure the platform isn’t simply mimicking a low-cost S&P 500 fund.
Quantitative Indicators Table
| Indicator | Purpose | Institutional Benchmark |
| Sharpe Ratio | Risk-adjusted return | > 0.8 |
| Sortino Ratio | Downside risk-adjusted | > 1.2 |
| Beta | Market sensitivity | 0.8 – 1.1 |
Risk Assessment in Systematic Platforms
The primary risk in this niche is not just “market risk” but “model risk”—the danger that the mathematical assumptions underlying the strategy become invalid due to changing market regimes.
Risk Mapping & Mitigation
| Risk Type | Probability | Impact | Mitigation Strategy |
| Model Decay | Medium | High | Regular backtesting and regime-switch detection. |
| Cybersecurity | Low | Extreme | Multi-factor authentication and cold-storage audits. |
| Liquidity Gap | Low | Medium | Utilization of highly liquid underlying ETFs. |
| Regulatory Change | Medium | Moderate | Compliance-first architecture. |
Note: Stress-testing should involve simulating “Black Swan” events, such as the 2020 flash crash or 2022’s rapid rate hiking cycle, to observe how the system manages liquidation.
Portfolio Allocation Strategy
Systematic platforms should ideally function as the “Engine Room” of a modern portfolio. They are best utilized to manage the core equity and fixed-income sleeves while the investor focuses on bespoke alternative assets.
Allocation Method:
- Core (60-70%): Broad-market systematic exposure via a digital platform.
- Satellite (20-30%): High-conviction individual stocks or sector-specific tilts.
- Alternatives (10%): Private equity, real estate, or digital assets.
ESG and Sustainability Considerations
Modern digital platforms are uniquely positioned to implement ESG (Environmental, Social, and Governance) criteria through “Custom Indexing.”
| ESG Factor | Relevance | Risk Level |
| Carbon Footprint | High | Medium (Regulatory) |
| Board Diversity | Moderate | Low |
| Data Privacy | Extreme | High (Legal/Reputational) |
Social Impact: Platforms often allow for the exclusion of specific industries (e.g., tobacco, firearms) at the individual account level.- Governance: Automated voting proxies are becoming a standard feature, allowing retail investors to exercise governance rights.
Implementation Roadmap for Investors
To successfully integrate systematic wealth platforms into an investment strategy, follow this execution algorithm:
- Objective Definition: Determine if the goal is capital appreciation, income, or tax optimization.
- Risk Tolerance Mapping: Use quantitative tools to define your “pain threshold” for drawdowns.
- Platform Vetting: Compare at least three platforms based on fee structure, security protocols, and asset availability.
- Initial Sizing: Start with a “Pilot Position” (e.g., 5–10% of total liquid net worth).
- Monitoring: Review quarterly performance against a relevant “blended” benchmark.
- Rebalancing: Allow the platform’s automated tools to manage drift, but conduct a manual “Sanity Check” annually.
Appendix: Metrics and Analytical Tools
For advanced analysis of systematic performance, the following formulas are standard:
Sharpe Ratio Calculation:
$$S_p = \frac{R_p – R_f}{\sigma_p}$$
Where:
- $R_p$ = Expected portfolio return
- $R_f$ = Risk-free rate
- $\sigma_p$ = Portfolio standard deviation
Data Sources for Research:
- SEC EDGAR: For institutional 13F filings of platform providers.
- Morningstar/Direct: For ETF and mutual fund performance analytics.
- Platform Whitepapers: To understand the underlying algorithmic logic.
Frequently Asked Questions
- What is the minimum capital requirement?
- Most modern digital platforms allow for entry with as little as $500–$1,000, though direct indexing often requires $50,000+.
- How do these platforms perform in a recession?
- Performance depends on the “Signals” the model uses. Trend-following models typically outperform in sustained downtrends, while mean-reversion models may struggle.
- Is my money safe if the platform goes bankrupt?
- In the U.S., look for SIPC (Securities Investor Protection Corporation) coverage, which protects the assets held in brokerage accounts, even if the platform provider fails.